
Time as Currency: Measuring Effort Expended in Accumulating Entries for Online Prize Promotions
Participants in online prize promotions treat time as the primary resource when building entry totals across daily draws and recurring contests, and data from multiple platforms shows that users allocate between 15 and 45 minutes per session to complete required actions such as form submissions, verification steps, and confirmation clicks. Researchers tracking activity logs have documented how these intervals accumulate over weeks, turning personal schedules into measurable inputs that determine overall participation volume without any direct monetary outlay.
Quantifying Effort Through Session Duration and Frequency
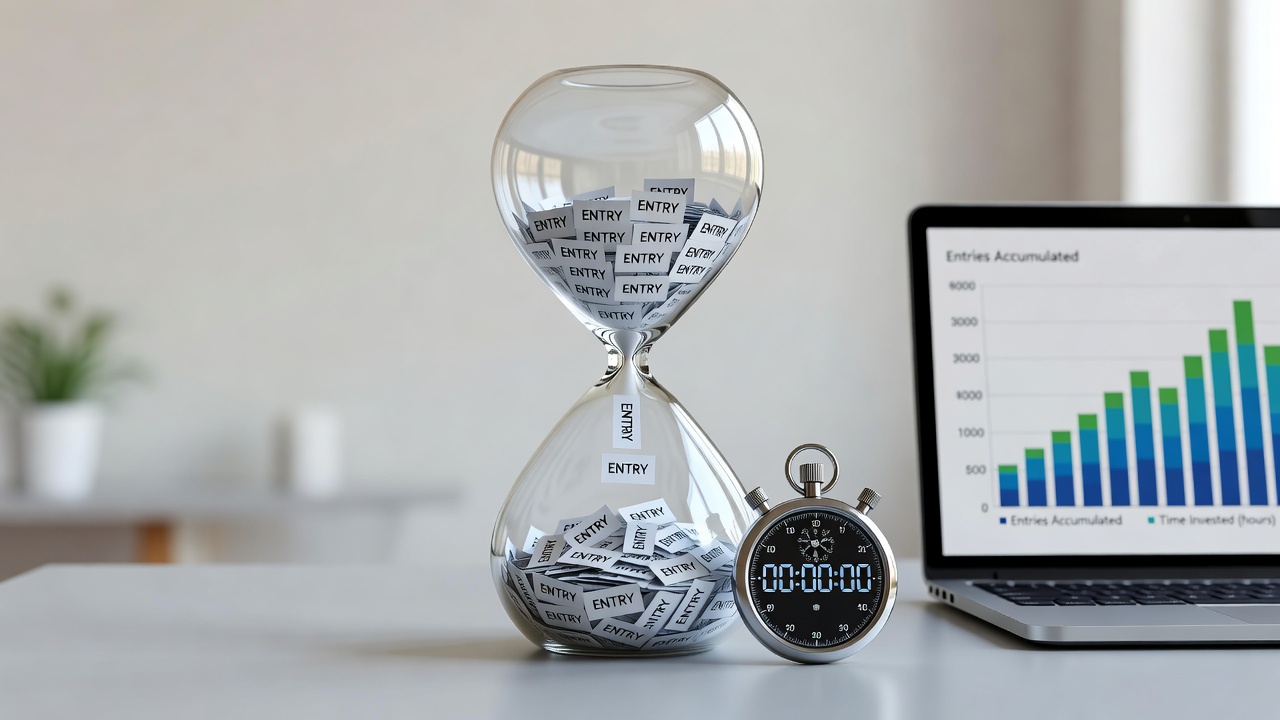
Platform analytics reveal that average users log between 8 and 22 distinct entry attempts each week, with each attempt requiring navigation through captcha systems, account logins, and optional social tasks that extend the process by additional minutes. Studies conducted by academic teams at institutions focused on digital consumer behavior indicate that total time invested correlates directly with entry counts, producing datasets where longer cumulative hours align with higher submission totals across state-regulated environments. Observers note that individuals who spread these sessions across morning and evening windows maintain steadier accumulation rates than those who cluster activity into single blocks, because fragmented timing avoids platform cooldown periods that limit rapid repeats.
Device Choice and Its Impact on Time Allocation
Mobile interfaces typically reduce per-entry completion time by 20 to 35 percent compared with desktop workflows, according to aggregated usage statistics collected during 2025 platform audits, yet desktop sessions often allow simultaneous multi-tab entries that offset the speed difference. Data collected through cookie-based tracking shows participants switching between smartphones and laptops within the same hour-long window, creating hybrid patterns that maximize submissions while managing battery and data constraints. Those who monitor their own activity through built-in timers report that mobile entries demand less cognitive load per task, freeing mental resources for repeated daily cycles that run through August 2026 and beyond.
Regulatory Frameworks Shaping Time-Based Participation
Rules issued by the Federal Trade Commission outline disclosure requirements that influence how much time entrants must spend reading terms before submission, and similar guidelines from the Australian Competition and Consumer Commission require clear statements on entry limits that indirectly cap daily time expenditures. Compliance records from multi-state operators demonstrate that these mandates add fixed intervals of 30 to 90 seconds per entry for legal notices alone, producing measurable extensions in overall effort across thousands of users. Figures released in regulatory summaries further show that jurisdictions with stricter verification steps experience slightly lower repeat-entry frequencies, because the added authentication layers extend each session without increasing prize probability.
Industry reports compiled by research groups at universities in Canada and the European Union document parallel trends, where time caps embedded in promotion rules create predictable ceilings on weekly participation hours. These constraints force users to prioritize which contests receive attention, resulting in concentrated effort on events that offer multiple daily windows rather than single-draw formats. Analysts tracking these shifts note that the distribution of time across contests follows power-law patterns, with a small percentage of users accounting for the majority of accumulated entries in any given month.
Measurement Tools and Data Collection Methods
Operators employ timestamped logs to calculate average effort per entry, combining clickstream data with session duration metrics that produce granular reports on how long each demographic segment spends on verification versus creative submission tasks. External audits conducted by independent research firms confirm that these measurements remain consistent across different prize categories, although seasonal spikes appear during holiday periods when increased leisure availability extends average daily time budgets. Participants who review their personal logs through account dashboards can identify which entry types consume disproportionate minutes, allowing adjustments that redistribute effort toward higher-yield activities without altering total hours committed.
Comparative Analysis Across Platforms
Cross-platform comparisons indicate that sites offering streamlined mobile apps reduce cumulative time per 100 entries by measurable margins, while those relying on browser-based flows extend the same benchmark by several hours over a month-long period. Government statistical agencies in multiple regions have begun incorporating time-use modules into broader consumer surveys, yielding datasets that place online prize participation alongside other digital leisure activities in national time-budget reports. The resulting figures allow researchers to model opportunity costs, showing how minutes directed toward entry accumulation displace alternative online tasks at consistent ratios across user cohorts.
Conclusion
Time functions as the measurable currency in online prize promotions because every entry requires documented intervals of user attention, verification, and navigation that aggregate into weekly and monthly totals tracked through platform analytics. Regulatory disclosures and academic datasets continue to refine these measurements, providing clearer pictures of how device preferences, session timing, and compliance steps shape participation depth. As August 2026 approaches, ongoing data collection from operators and oversight bodies supplies fresh benchmarks that illustrate the precise relationship between expended effort and accumulated entries across regulated digital environments.