How Push Notification Cadences Shape Sustained Interest in Extended Online Giveaway Campaigns
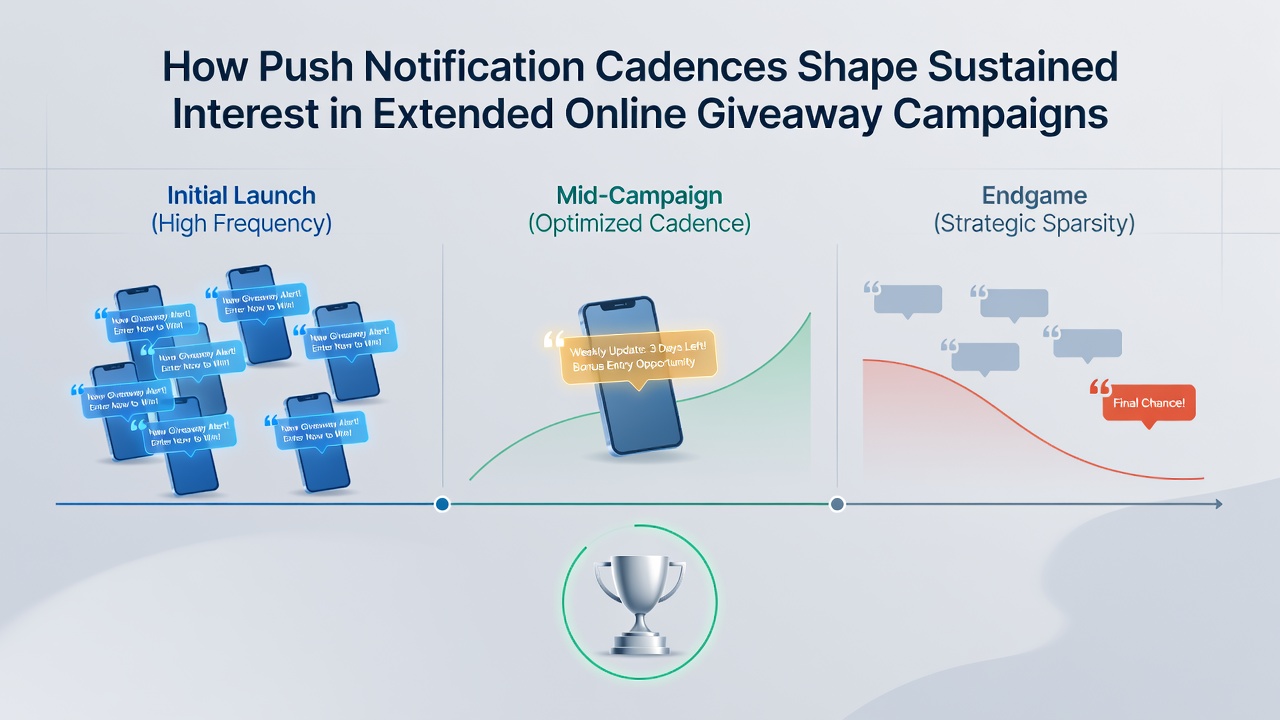
Push notification systems deliver timed messages to users who have opted into receiving updates from online giveaway platforms, and the spacing between these alerts plays a measurable role in how participants maintain activity over campaigns that stretch across weeks or months. Data from digital promotion platforms indicates that cadences ranging from daily bursts to weekly summaries produce distinct patterns in entry submissions and session durations. Observers tracking user behavior note that campaigns running from January through June 2026 have tested intervals such as three alerts per week versus one every ten days. Those intervals correlate with different retention curves, where shorter gaps between messages tend to coincide with higher immediate clicks yet steeper drop-offs after the first month. Longer intervals, by contrast, align with steadier but lower-volume participation that holds through later stages of an extended promotion.Frequency Patterns Observed in Multi-Week Events
Studies of recurring prize drawings show that notification density influences the rhythm of user returns. Platforms sending messages every forty-eight hours record elevated open rates during the opening fourteen days, after which engagement metrics flatten unless content varies. In comparison, systems spacing messages four to five days apart maintain more consistent click-through figures past the thirty-day mark, according to aggregated platform analytics.
Researchers examining entry logs find that users who receive clustered notifications early in a campaign often complete initial submissions quickly, yet they show reduced activity unless follow-up messages introduce new prize tiers or rule clarifications. This pattern appears across both mobile-dominant and desktop-hybrid user groups.
Timing Variables and Regional Participation Data
Time-of-day delivery further modulates outcomes. Messages arriving between 8 a.m. and 10 a.m. local time register higher response rates than those sent after 8 p.m. in multiple North American datasets. European platforms report similar morning advantages when adjusted for time zones, while Australian campaigns note stronger evening engagement, suggesting regional differences in daily routines shape optimal windows.
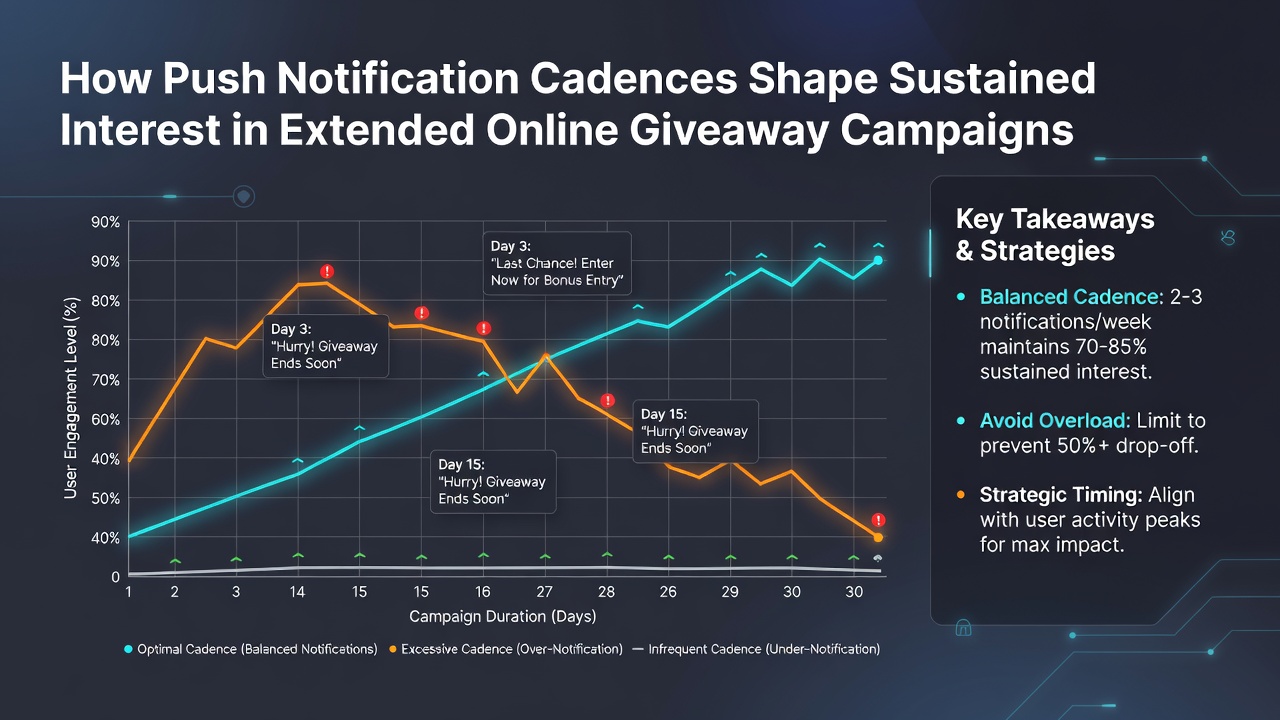
One analysis of state-regulated promotions conducted through mid-2026 found that campaigns incorporating at least one mid-week reminder alongside a weekend summary sustained entry volumes 18 percent longer than those relying on uniform daily alerts. The same review linked excessive daily messaging to a measurable rise in opt-out requests after week three.
Personalization Elements Within Cadence Design
Segmentation by past entry history allows operators to adjust spacing for different cohorts. Users who submitted multiple entries in prior events receive fewer but more targeted updates focused on new prize categories, whereas first-time participants receive slightly denser sequences that taper after the initial week. Platform records indicate this approach reduces unsubscribe rates compared with uniform schedules applied across all accounts.
Content variation within the chosen cadence also matters. Alerts that rotate between prize announcements, rule reminders, and progress updates maintain open rates better than repetitive templates, even when the underlying interval stays constant. Industry reports compiled by the Federal Trade Commission highlight that clear differentiation between message types helps users distinguish promotional content from routine updates.
Measurement Approaches Used by Platform Operators
Operators evaluate cadence effectiveness through metrics that include time-between-entries, total submissions per user, and lifetime campaign duration for each participant. A/B testing frameworks deployed during the first quarter of 2026 compared three-message-per-week schedules against bi-weekly patterns and documented divergent survival curves for active user cohorts. These tests typically run for at least six weeks to capture late-stage retention shifts.
Additional layers such as device type and geographic cluster add granularity. Smartphone users respond more readily to shorter intervals, while desktop users show steadier interaction with longer gaps. Platforms serving multiple states or provinces adjust default cadences by region to align with observed submission peaks.
Conclusion
Push notification cadences function as a controllable variable that correlates with how long participants remain active in extended giveaway campaigns. Evidence gathered through 2026 demonstrates that balanced intervals, combined with content rotation and cohort segmentation, correspond to more stable engagement trajectories than either very dense or very sparse schedules. Platform operators continue to refine these patterns using ongoing performance data rather than fixed rules, allowing adjustments as user behavior evolves across different campaign lengths and prize structures.