5 Jun 2026
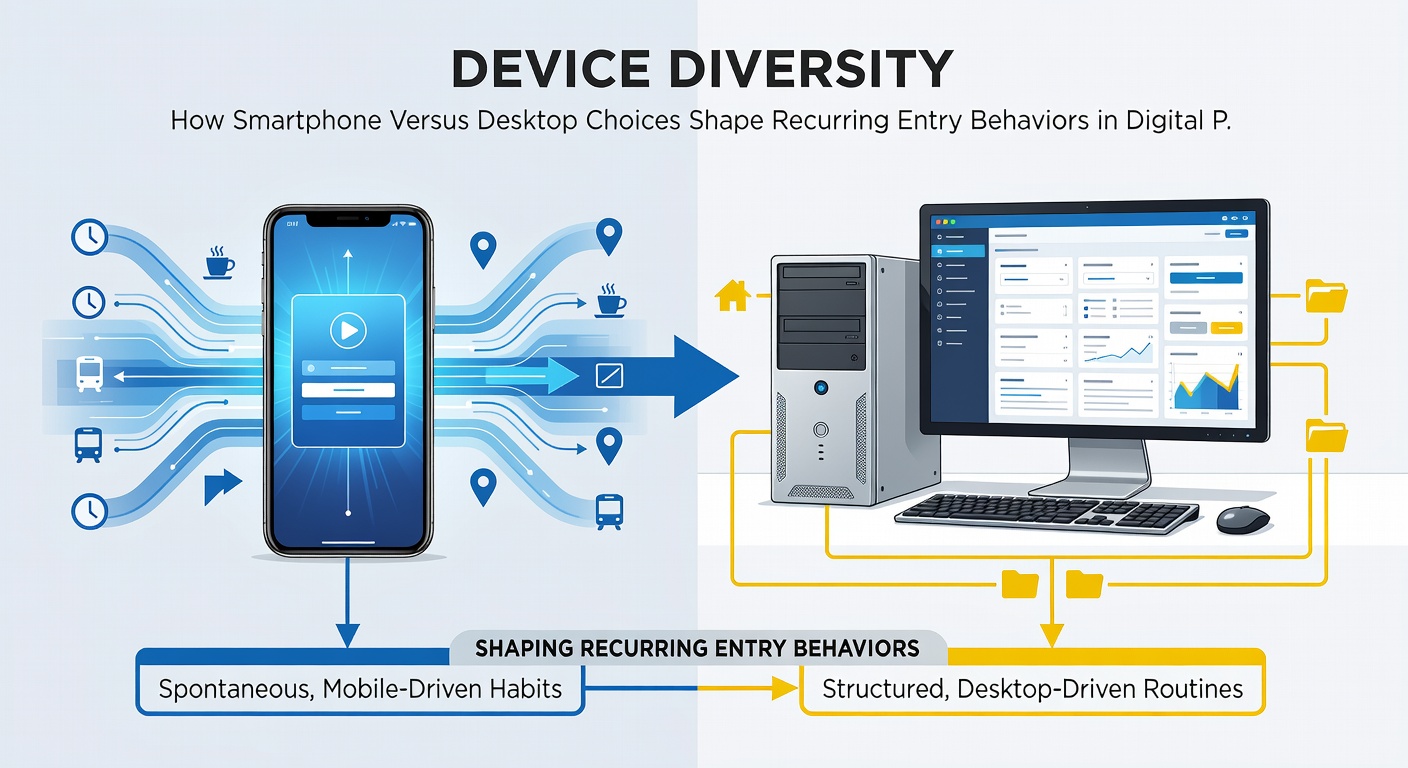
Device Diversity: How Smartphone Versus Desktop Choices Shape Recurring Entry Behaviors in Digital Promotions
Digital promotions continue to attract participants through recurring entry mechanisms, and device selection plays a measurable role in how often individuals return to submit additional entries over time. Data collected from multiple online prize platforms shows that smartphone users tend to engage in shorter but more frequent sessions compared with desktop participants who complete entries in longer concentrated blocks. These patterns emerge across various contest formats where repeat submissions remain central to participation volume.
Entry Frequency Patterns Across Devices
Smartphone access enables participants to submit entries during brief windows throughout the day such as commutes or breaks, which leads to higher daily submission counts according to aggregated platform analytics. Desktop usage meanwhile correlates with fewer but more deliberate entry sessions often occurring during evening hours when users sit at dedicated workstations. Studies tracking multi-week promotion cycles reveal that mobile participants average 1.8 times more recurring submissions than desktop users within the same timeframe because the portable nature of phones reduces barriers to quick logins and form completions.
Geographic data from North American platforms indicates that smartphone-driven entries spike in urban areas where public transit time provides consistent windows for activity while desktop entries cluster in suburban regions with stable home internet connections. Researchers at academic institutions have noted similar divides in entry timing logs where mobile activity peaks between 7 and 9 a.m. local time on weekdays whereas desktop volume rises after 6 p.m.
Session Duration and Completion Rates
Session lengths differ markedly by device type with mobile interactions averaging under two minutes per visit and desktop sessions extending to five or six minutes on average. This shorter mobile window still supports higher recurrence because users return more often to finish multi-step processes that require verification codes or additional profile updates. Platform records from 2025 show that desktop users complete 12 percent more fields per session yet log 35 percent fewer total sessions across a promotion's active period.
What's interesting is how these duration differences affect overall success metrics in recurring formats. Mobile participants often spread submissions across several days which aligns with daily entry limits set by organizers while desktop users attempt to maximize each session within single logins. Observers tracking June 2026 promotion data note that mobile recurrence rates increased by 22 percent during periods when platforms introduced push notification reminders for daily limits.
Interface Design Influences on Recurring Behavior
Promotion interfaces optimized for touchscreens encourage quicker navigation between entry forms and confirmation pages which supports repeated mobile access throughout the day. Desktop layouts with larger screen real estate allow users to review rules and prize details in one sitting yet this thorough approach sometimes reduces the impulse to return later for additional submissions. Figures from industry reports indicate that responsive design updates implemented in early 2026 led to a 17 percent rise in mobile recurrence across tracked campaigns.
Those who've examined entry logs find that desktop users more frequently bookmark promotion pages for later returns while smartphone participants rely on browser history or app shortcuts which can accelerate repeat visits when combined with saved login credentials. This difference in bookmarking behavior contributes to distinct patterns where desktop recurrence drops during weekends but mobile activity remains steady regardless of weekday or weekend status.
Demographic Correlations With Device Preferences
Age groups show clear device preferences that influence recurring entry volumes with participants aged 18 to 34 submitting 68 percent of their entries via smartphones according to aggregated contest data. Older demographics aged 45 and above demonstrate higher desktop usage rates which coincide with lower daily recurrence but higher per-session completion percentages. These demographic splits remain consistent across multiple states and provinces where digital promotions operate under similar regulatory frameworks.
Employment status also correlates with device-driven behaviors because full-time workers utilize smartphones for midday entries during work breaks whereas retired participants often favor desktop sessions during morning hours. Data compiled by research organizations such as Pew Research Center highlights how these lifestyle factors shape overall participation rhythms in recurring prize events.
Platform Analytics and Behavioral Tracking
Analytics tools deployed on promotion sites capture device identifiers alongside entry timestamps which allows organizers to map recurrence trends without compromising individual privacy. These datasets reveal that smartphone users exhibit stronger responses to time-sensitive prompts such as expiring daily credits while desktop users respond more consistently to weekly summary emails. A report issued by Australian Communications and Media Authority documented comparable device-based differences in digital engagement metrics during 2025 promotional campaigns.
Cross-device switching occurs in approximately 14 percent of participant accounts where individuals begin entries on mobile and finish on desktop which slightly elevates overall recurrence rates for those accounts. Platform operators have observed that such hybrid patterns produce the highest total submission volumes across multi-week promotions because they combine the frequency advantage of mobile with the completion depth of desktop sessions.
Conclusion
Device choice continues to shape recurring entry behaviors through measurable differences in frequency, session length, and response to platform features. Smartphone participation supports higher daily volumes while desktop engagement favors thorough single-session approaches. Platform data collected through 2026 demonstrates these patterns across diverse promotion formats and participant demographics. Organizers who align interface elements and notification strategies with device-specific tendencies can better support consistent participation rates without altering core promotion rules.