29 May 2026
Demographic Shifts and Their Correlation with Entry Volumes in State-Regulated Digital Promotions
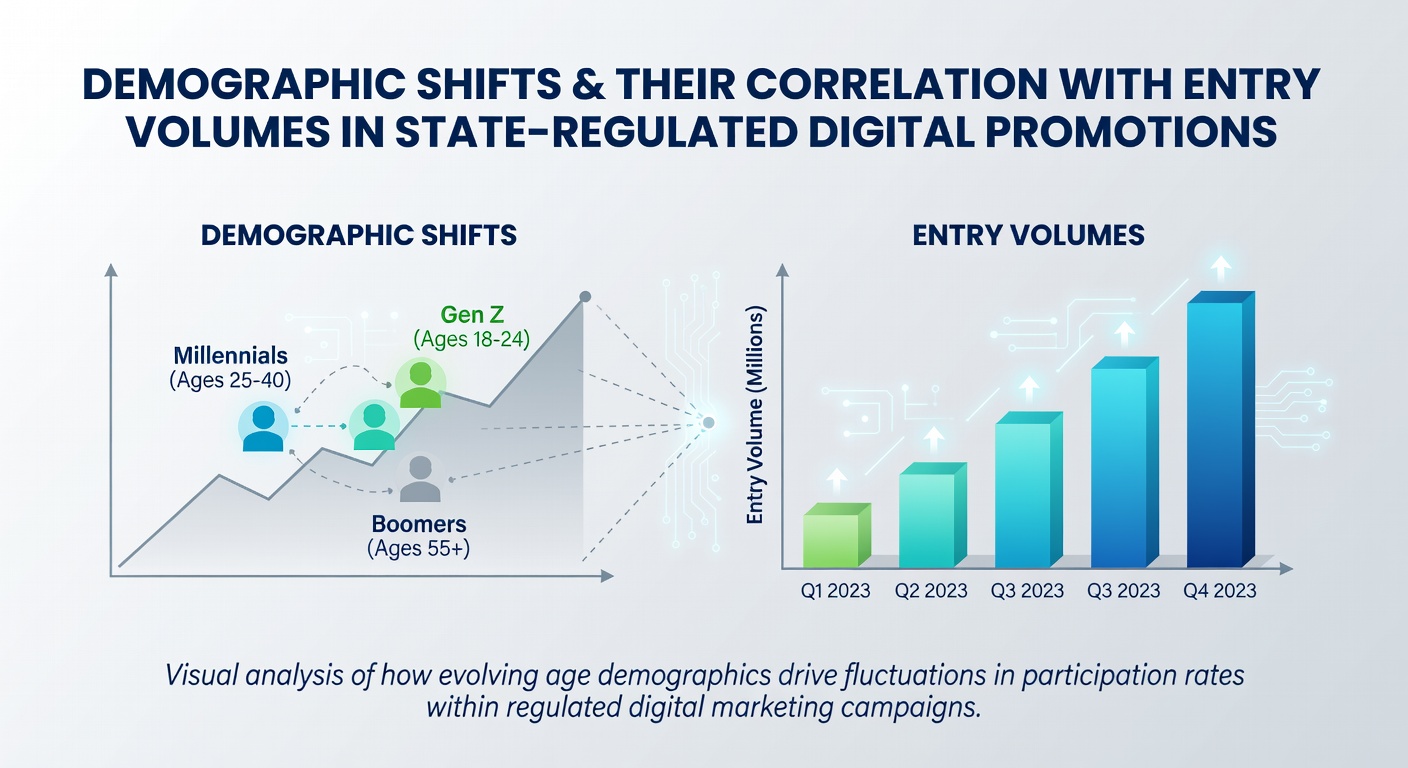
Population changes across age brackets, geographic regions, and income levels continue to reshape how people interact with state-regulated digital promotions, and entry volumes reflect these movements in measurable ways according to available participation data. Researchers tracking online contest and sweepstakes platforms note that shifts in younger cohorts entering the workforce coincide with increased mobile-based submissions, while older segments show steadier desktop engagement patterns through 2025 and into projected figures for May 2026.
Age Distribution Patterns and Submission Trends
Millennials and Gen Z participants drive much of the volume growth in states with permissive digital promotion rules, yet data from multiple jurisdictions indicates their entry rates fluctuate based on employment stability and device access rather than sheer population size alone. Observers note that states updating verification processes in 2024 saw a corresponding rise in submissions from users aged 25 to 34, who often combine work commutes with quick app-based entries during short breaks.
Older adults, particularly those between 55 and 74, maintain consistent participation in promotions tied to established retail and media partners, and their volumes remain less sensitive to short-term regulatory tweaks. Studies compiled by academic institutions show these groups favor promotions with longer entry windows, which allow time for reviewing terms before submission.
Geographic Mobility and Regional Access Variations
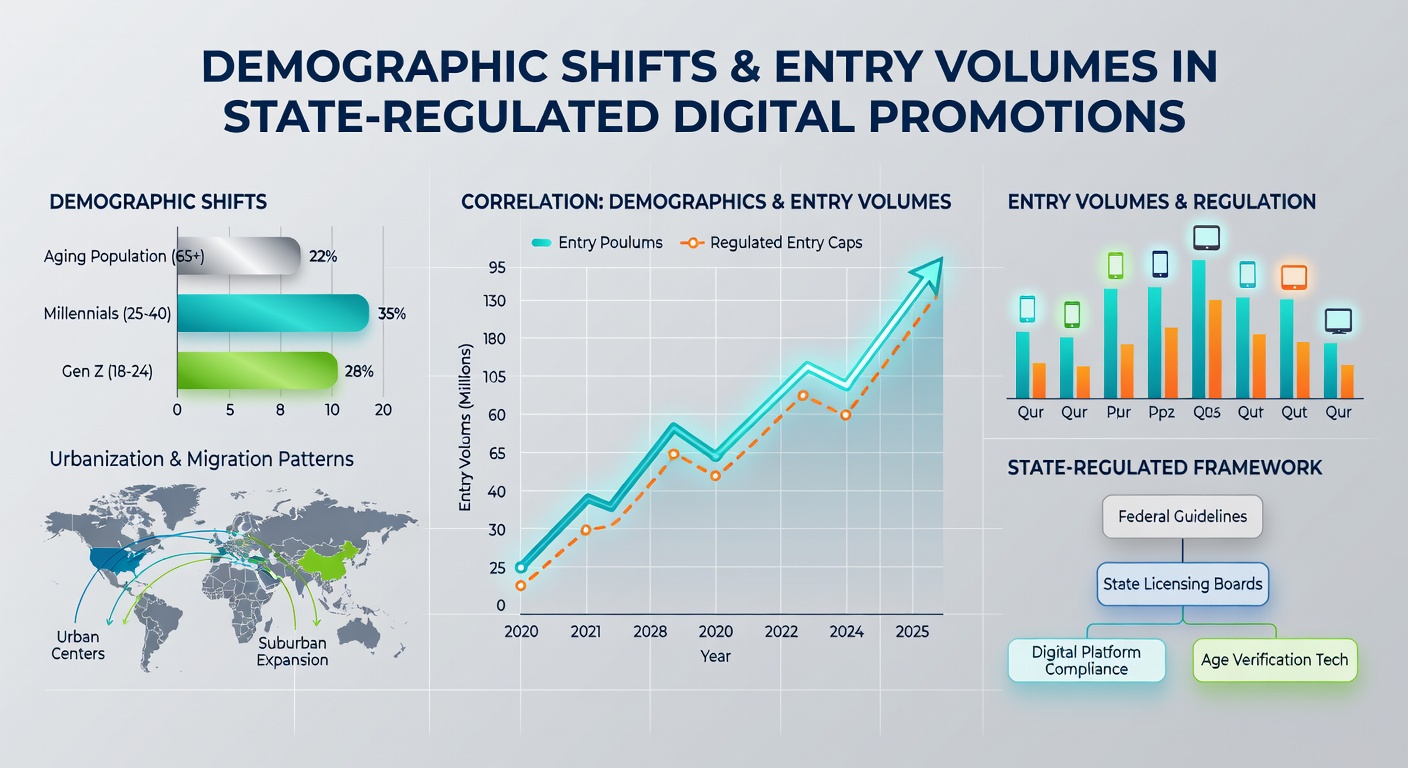
Urbanization trends have concentrated higher entry volumes in metropolitan areas where broadband infrastructure supports seamless participation, while rural populations exhibit lower overall rates despite similar interest levels in prize opportunities. State boundaries create additional layers because some jurisdictions require specific residency proofs that affect cross-border engagement from mobile users traveling for work or family reasons.
Canadian provincial regulators, for instance, publish periodic reports that separate entry data by urban versus rural postal codes, revealing how population density correlates with repeat submissions in regulated platforms. Similar patterns appear in analyses from Australian state gaming authorities, where coastal cities outpace inland regions in digital promotion activity.
Socioeconomic Factors Shaping Participation Volumes
Income brackets influence both the frequency and timing of entries, with middle-income households showing the highest consistency across recurring monthly promotions that align with paycheck cycles. Lower-income participants tend toward free-to-enter formats that do not require purchase proofs, and their volumes spike when states introduce simplified age and identity verification steps.
Higher-income groups participate more selectively, often concentrating entries around high-value prizes announced through targeted email campaigns. Research from university economics departments indicates these patterns hold steady even when overall platform traffic rises due to broader demographic expansions in a given state.
Regulatory Updates and Their Measurable Effects
State-level rule changes effective in early 2026 have begun to show preliminary impacts on entry distributions, particularly where new digital identity requirements favor users already comfortable with app-based verification. Platforms operating across multiple states report that compliance adjustments sometimes temporarily reduce volumes from older demographics until they adapt to updated interfaces.
Data aggregated through industry trade groups demonstrates that states harmonizing their promotion guidelines with neighboring jurisdictions experience smoother volume transfers among mobile users who cross state lines regularly. These alignments reduce friction for participants who previously encountered inconsistent residency checks.
Technology Adoption Across Demographic Segments
Smartphone penetration rates continue to correlate strongly with entry volumes in states that permit fully digital submission methods, and younger users leverage push notifications to maintain steady participation without dedicated planning. Older participants rely more on email reminders and web portals, which produces different daily and weekly volume curves visible in platform analytics.
Observers following these trends note that states introducing optional biometric verification options see accelerated adoption among tech-forward age groups, while others maintain traditional methods that preserve broader accessibility. Projections extending through May 2026 suggest continued divergence based on how quickly each demographic integrates new security features.
Conclusion
Demographic composition within each state interacts with regulatory frameworks to produce distinct entry volume signatures that evolve alongside population movements and technology access. Tracking these correlations provides clear visibility into how shifts in age, location, and income levels translate into measurable participation differences across regulated digital promotions. Continued monitoring of state-level data releases will clarify whether current patterns persist or adjust as new regulatory environments stabilize.